

9:41
All India Cut-off Ranks
Competition Level:
Very High
(
in 25')
2023
5,500
SR2
2024
5,500
Special..
2024
5,500
SR3
You (4506)
Detailed Report
Get shortlisted courses, admission chances by selected branch, city, fees plus counselling info
Download PDF
The College Predictor rebuilt for 10M+ students
Redesigning the admissions experience nationwide. Combining prediction summaries, probabilities, and downloadable reports into one tool made complex decisions easy—driving a +72% peak-week revenue jump and shifting ~80% of buyers to our combo pass.
Visit Website
View Case Study
Historical Data Analysis
5+ years of cutoff trends
Smart Predictions
AI-powered probability analysis
Verified Data
Official sources only
My role
Sr. Product Designer
Discovery → Redesign →Launch
I owned
Research · UX Strategy · Product Design
Team
1 PM · Engineering
Sole Product Designer
Status
LIVE
Web + Android app
Context & Problem
A critical decision, made in a hurry, with the wrong map.
Every year, 15M+ students sit for competitive entrance exams in India. In the narrow 7–10 day window after results, they must lock their official choices on national and state counselling portals. The order they submit is irreversible.
Careers360's College Predictor answered "what are my options?" by matching ranks, categories, and states against 5+ years of historical cutoff data.
However, observing user behavior during peak counselling week revealed a critical gap: faced with 1,000+ unranked results, students hit decision fatigue and dropped off. The tool delivered raw data, but missed the real question: "Which colleges should I prioritize, and in what order?"
15M+
Aspirants sitting target exams yearly
7–10 Days
Window to lock irreversible choices
1,000+
Raw options returned per query
The moment that defined the brief
It gave me 1,000+ colleges. My counselling form has 20 slots. I still don't know what to put in slot one.
Aarav Chauhan (JEE Main Rank ~41K)
Recorded Usability Session · Day 2 of JoSAA
BEHAVIORAL BREAKDOWN
The drop-off wasn't in discovery. It was at the decision.
Traffic was never the bottleneck—the predictor was one of our most-visited tools. Mapped directly from session walkthroughs, user confidence broke down right at action: not at "got my results," but at "what do I do next?"
Why this was worth a redesign, not a tweak
Raw Data, Zero Guidance
Answers "What are my options?" but fails to address "What should I do next?"
Flat Visual Hierarchy
Without visual distinction, top-tier dream colleges and safety backups looked identical.
High-Stakes Friction
Because counselling choices are irreversible, ambiguity creates instant decision stress.

9:41
Scroll Ends, Decision Doesn't
Students reached the bottom of a flat list with no way to compare or shortlist—breaking the core value loop.
The Paradox of Choice
Showing 1,000+ options with equal weight caused choice paralysis instead of confidence.
Jobs To Be Done
What students were really trying to accomplish
Research
3 in 4 students dropped off before seeing a prediction
We combined behavioral analytics, funnel analysis, session recordings, and heatmaps to uncover where students dropped off - and why.
374,082
Students
analyzed
75.11%
Exited before prediction results
100+
Behavioral sessions reviewed

Funnels
Locating exactly where 75% of high-intent traffic abandons the flow.

Heatmap
High engagement at the input fields, but total blindness below the fold.

Recording Sessions
Revealing real-time choice hesitation, fatigue, and sudden exits.
Problem
Choice Overload
Students faced thousands of unranked colleges, making it difficult to identify realistic options and move forward
Problem
The Trust Gap
Predictions lacked transparency, prompting students to leave and validate results on other platforms.
Problem
Wrong Mental Model
Students chose branches, not just colleges, but the experience was built around institutions instead of outcomes.
Problem
Decision Friction
Too many equally important actions increased hesitation at the moment students were ready to decide.
Problem
Broken Momentum
The journey ended with predictions, offering no way to shortlist, save, or confidently continue their admission journey.
Problem
Shared Decisions
Students and parents made decisions together, yet the experience provided no shared view to build confidence.


From data to insights
Design strategy
The Design Hypotheses
Translating research insights into testable If we... then... bets ensured every design decision directly targeted a core behavioral bottleneck.

Rahul
Students get 1,000+ results and freeze — abundance reads as overwhelm.
If we lead with a chance verdict - Good / May Get / Tough -then students orient themselves before they ever scroll the list.
Rahul
A row of equal-weight CTAs re-creates the overwhelm in button form.
If we set one primary action (Shortlist) and defer the rest, then students take a clear next step instead of stalling.
Rahul
A bare probability isn't believed — students cross-check 2–3 other sites first.
If we show the math — category-adjusted rank + cut-off history — then the number becomes evidence they trust.
Rahul
The decision dies inside the tool — a shortlist that never leaves is a dead end.
If we put shortlist, report & counselling one tap from every row, then the decision survives the jump to JoSAA.
Rahul
Predictions are per-college, but a student's real choice is per-branch.
If we compute chance per course, not per institute, then the result matches how students actually decide.
Rahul
Students and parents disagree, and neither has shared ground to argue from.
If we give a credible, shareable comparison, then the choice feels joint and defensible - not a gamble.

How I explored the concepts
Three honest bets to close the decision gap
I diverged hard before converging. I prototyped all three and pressure-tested them through internal testing and iteration; here's what I learned and why one won.
Concept A
Concept B
Concept C
Shipped
Concept A
The Enhanced
Filter List
Focusing on high scannability. Retained a dense list view with a classic sidebar, introducing top-level chance filters and an Admission Summary chart for instant grouping.
Hypothesis: Structured multi-attribute filtering will speed up exploration.
The Gap: Improved search speed, but failed to solve choice paralysis on longer scrolls.


From Passive Data Dump to Guided Decision-Making
Instead of forcing students to process flat lists on their own, the redesign surfaces historical trends and planning tools in context to drive decision momentum.

Before
(Legacy Pipeline)
After
(The Dynamic Decision Loop)
Good/May/Tough
Shows probability instantly
Shortlisted
Saves for later
Important Notes
Highlights key rules
Goal-Based Filters
Speeds up decision-making
Layout Toggle
Swaps card/table view
Eligibility Rank Mapping
Matches real ranks
landing page
Understanding intent
before prediction
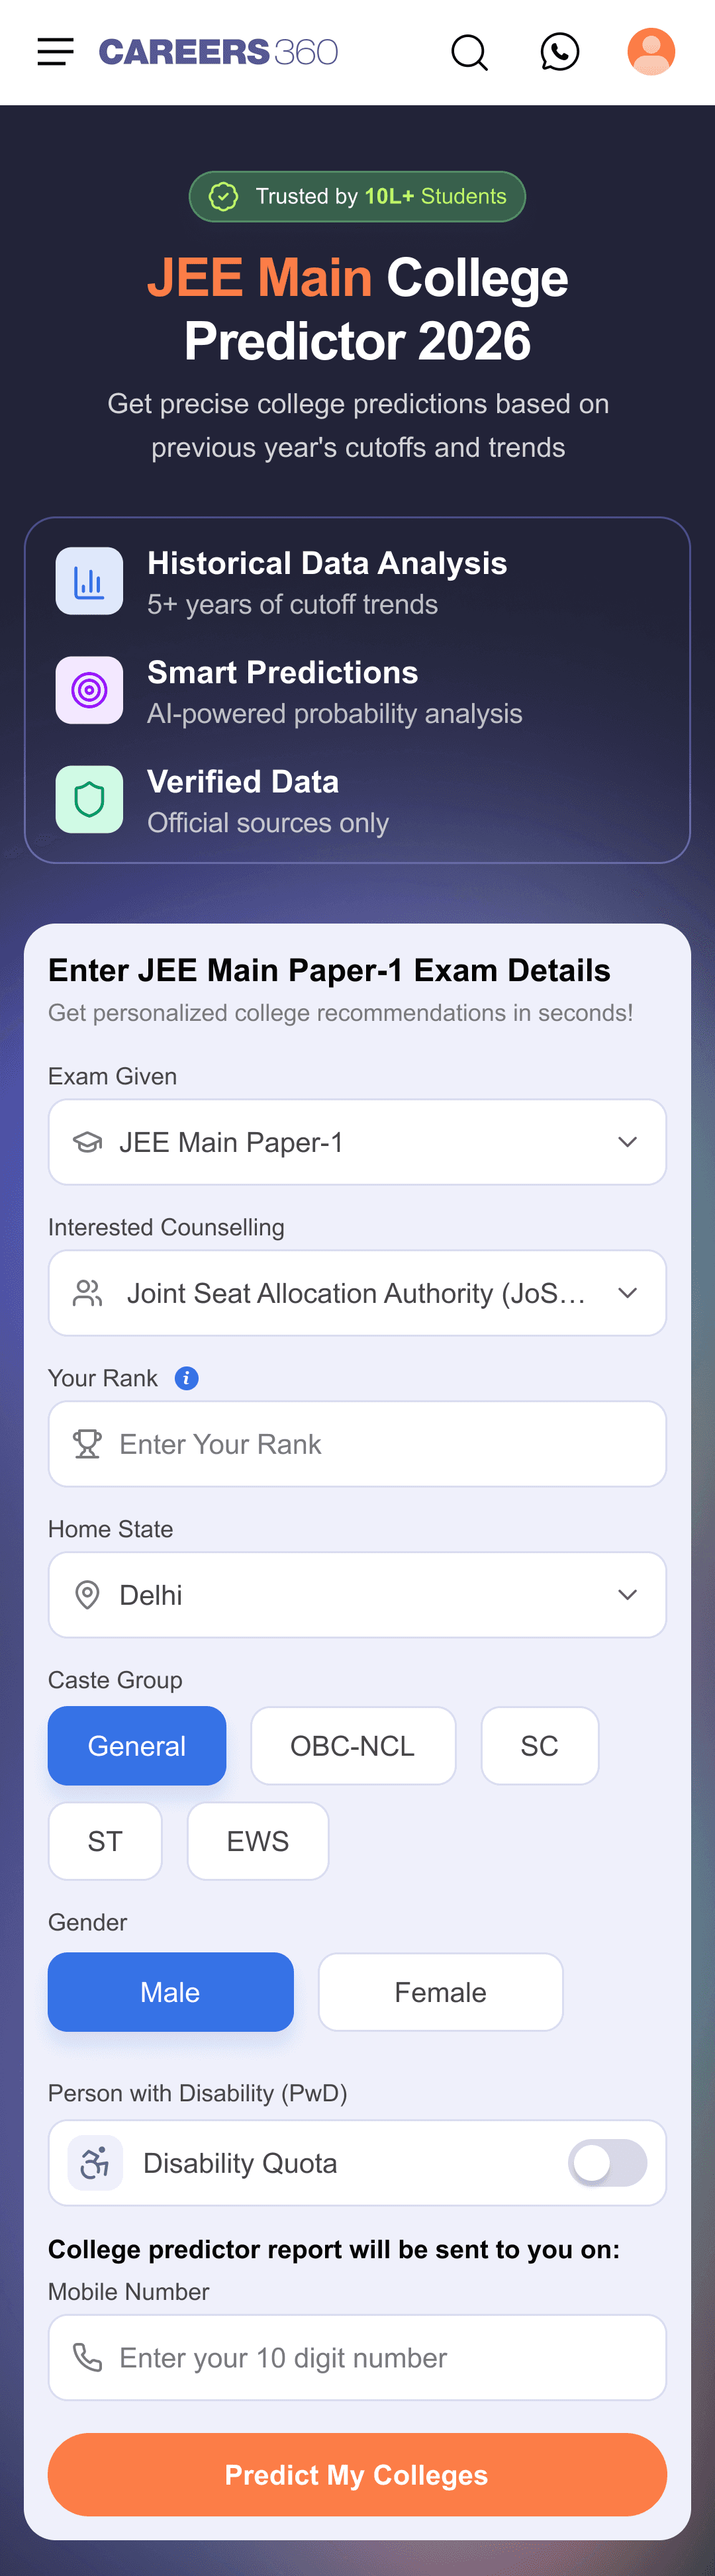
Instead of hiding input fields behind multiple steps, the core predictive form is embedded directly into the first fold.
By pairing these fields with clear, trust-building value pillars, this single workspace minimizes top-of-funnel drop-offs and drives immediate decision momentum.
9:41
www.careers360.com
Trusted by 10L+ Students
JEE Main College
Predictor 2026
Get precise college predictions based on previous year's cutoffs and trends
Historical Data Analysis
5+ years of cutoff trends
Smart Predictions
AI-powered probability analysis
Verified Data
Official sources only
Enter JEE Main Paper-1 Exam Details
Get personalized college recommendations in seconds!
Exam Given
JEE Main Paper-1
Interested Counselling
Joint Seat Allocation Authority (JoSAA Counselling)
Your Rank
Home State
Delhi
Caste Group
General
OBC-NCL
SC
ST
EWS
Gender
Male
Female
Person with Disability (PwD)
Disability Quota
College predictor report will be sent to you on:
Mobile Number
Predict My Colleges
Enter JEE Main Paper -1 Exam Details
Get personalized college recommendations in seconds!
Exam Given
JEE Main Paper-1
Interested Counselling
Joint Seat Allocation Authority (JoSAA Counselling)
Your Rank
Home State
Delhi
Caste Group
General
OBC-NCL
SC
ST
EWS
Gender
Male
Female
Person with Disability (PwD)
Disability Quota
College predictor report will be sent to you on:
Mobile Number
Predict My Colleges
Trusted by 10L+ Students
JEE Main College Predictor 2026
Get precise college predictions based on previous year's cutoffs and trends
Historical Data Analysis
5+ years of cutoff trends
Smart Predictions
AI-powered probability analysis
Verified Data
Official sources only
https://www.careers360.com

9:41

9:41

9:41
9:41
Simple Inputs: Keeps the form fast and effortless
Verified Sources: Shows real data sources upfront
Immediate Proof: Eases hesitation right at the button
Clear Outcome: Shifts copy from a search tool to a guide
10M+ Scale Metric: Instantly proves credibility
Personalized Cards: Highlights clear value before they click
Real Student Stories: Builds confidence at the final step
Catch-All CTA: Gives long-scrollers an easy next step

https://www.careers360.com
9:41
www.careers360.com

Zero
Friction

9:41
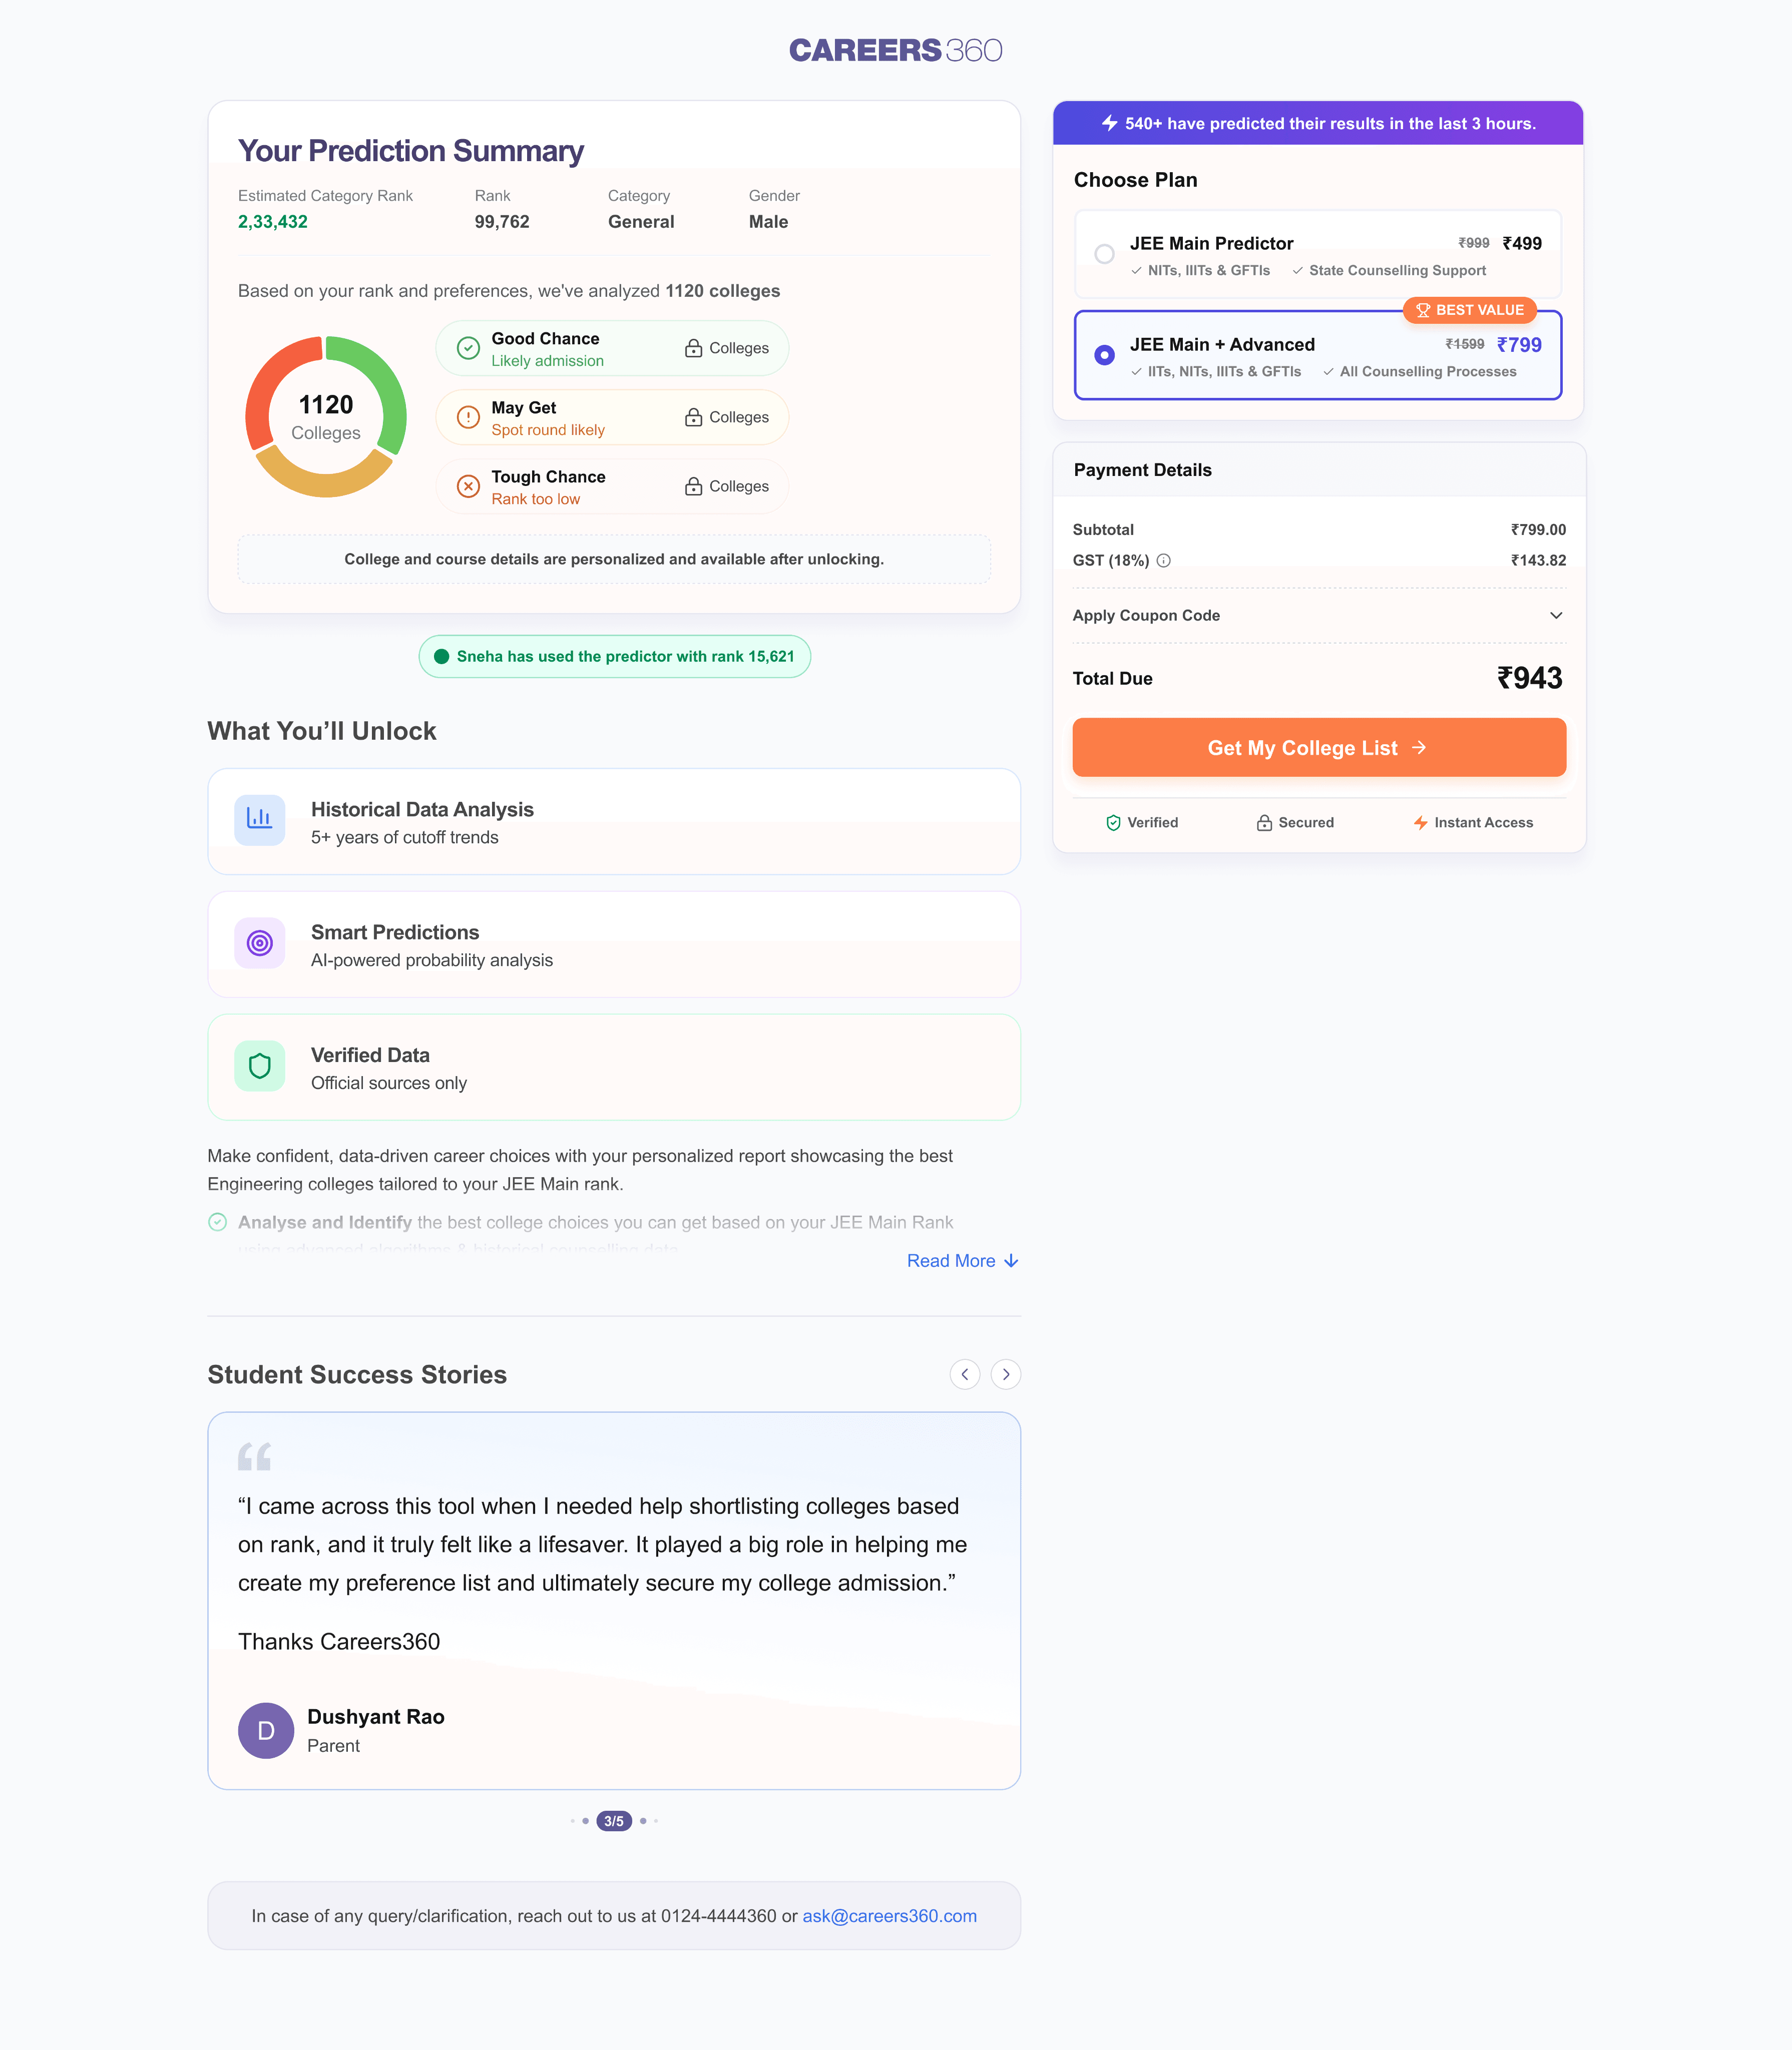
Total Due
₹943
Get My College List
order summary
By anchoring the checkout flow to explicit value reminders and real-time social proof, this workspace minimizes late-stage drop-offs and accelerates transaction velocity.
Value Affirmation, Seamless Intent

9:41

9:41

9:41


9:41
No post-payment anxiety: Instant confirmation and clear receipt details eliminate anxiety, sending users directly to their results.
Reassuring error states: Simple messaging explains what went wrong without causing panic, giving a clear one-tap retry.
Transparent pending states: Clear status updates and transaction details reassure users while their payment is processed in the background.
Clear value upfront: Clear plan comparisons and live social proof make value obvious, reducing hesitation right before checkout.

9:41
www.careers360.com

https://www.careers360.com
From Static Results to
Confident Choices
Showed real-time activity right next to the filter and shortlist tools to build instant trust at the exact moment they decide.
We turned the result page from a passive report into a decision engine. By showing students clear prediction chances alongside live activity from peers, we removed final-step doubt and made the next step obvious.
Broke down over 1,000 college choices into simple, color-coded odds (Good, May Get, Tough) so users immediately see where they stand.
Instant Clarity
Peer Reassurance
THE result page


9:41

9:41
Embedded 1:1 guidance directly within the flow for students who feel stuck or overwhelmed by choices, providing instant clarity.
Grouped multi-tag filters by probability tier (Good, May Get, Tough) and quick filters, eliminating fatigue to build a focused shortlist.
Brought key data like fees, placement CTCs, cut-offs, and seat availability so students can evaluate options without leaving the page.

Visualized multi-year trends across counselling rounds in a clean modal, letting students benchmark admission chances with precision.
Every element on the card is engineered to eliminate guesswork and guide students toward high-intent action.
Personalized Rank Mapping
Plots the user's exact rank directly against historical cut-offs for an intuitive visual comparison.
Multi-Year Context
Surfaces 3-year historical trends and competition levels to set realistic expectations.
Frictionless Actions
Pairs shortlisting with instant secondary pathways - like side-by-side comparison - to keep exploration moving forward.
Upfront Verdict
Leads with clear, color-coded likelihood tiers (Good, May Get, Tough) so students know where they stand at a glance.
UX Decisions That Reduce Uncertainty

trade-off decisions
The hardest constraint wasn't technical - it was alignment.
The PM and I clashed over one thing: how many calls-to-action the screen should push. Working through it is what made the final direction strong - so I'm putting it first.
My Position · Design
One clear action per state. Everything else stays secondary
Compare, Shortlist, View Report, Book Counselling, Talk to an Expert, Download Brochure — stacking them all at equal weight is just the overwhelm again, in button form. A screaming row of CTAs makes the real next step impossible to find.

Ashok Singh
Sr. Product Designer
PM's Position · Product
Surface all CTAs to capture immediate conversion & revenue
Several of those actions are how the product earns its keep. Hiding them risked engagement and revenue, and the PM rightly didn't want to ship a beautiful tool that under-delivered on the roadmap.

Karan Goel
Senior Product Manager
How I Resolved It
Not "how many CTAs," but "which one is primary—and when do the rest appear?"
I set a clear CTA hierarchy instead of cutting actions. One primary CTA—Shortlist-gets the solid coral button on every row because it moves students toward a decision. Compare and View Report become quiet inline links. Business-critical actions—counselling, talk-to-an-expert, and direct admissions—surface as contextual cards deeper in the flow, only when relevant.
OUTCOME & MEASUREMENT
What shipped, what moved, and how
the design proved its value.
We launched the new NEET College Predictor for 10M+ students. Replacing confusing tables with clear chance levels cut drop-offs and boosted purchases in 20 days.
-35%
Drop-off Reduction
Recorded across the first 20 days of live release.
40%
Purchase Rate
Jumped from 69/1,359 (~5%) to 400/1,000 (40%).
10M+
Student Reach
Active users across JEE Main, EAMCET & KCET.
VALIDATED HYPOTHESES
Driving high-intent product purchases
400/1,000 users (40%) purchased the product post prediction - up from 69/1,359 baseline
takeaway
Leading with plain-language verdicts guides students straight to value-adding paid offerings.
NORTH STAR SIGNAL
9:41
result
Eliminating triage paralysis at scale
-35% drop in drop-offs recorded across the initial 20-day launch window.
takeaway
Grouping scattered results into structured chance bands eliminated choice overload at the top of the funnel.
Friction reduction
9:41
result
9:41
Preserving algorithmic trust across edge cases.
10M+ students served smoothly across 14 distinct edge-case result states.
takeaway
Keeping data transparent enough that students & parents felt confident anchoring decisions and purchases on the output.
STRATEGY & TRUST
result
What worked
Live Season Research
Studied real-time student behavior during peak counseling to capture unfiltered signals.
Open Access & Trust
Replaced paywalls with transparent probability tiers, proving open data drives purchases better than artificial gating.
What I'd do differently & next
Post-Counseling Follow-Up
Track actual seat allotments post-counseling to continually feed real outcomes back.
Side-by-Side View
Compare "Good Chance" options side-by-side instead of single rows, letting students evaluate competing colleges in seconds.
What I'd carry forward
9:41
Decision Clarity
Data Overload
Guided Action

The win wasn't a prettier results page. It was a reframe - from "show options" to "support a decision"
The Real Breakthrough
Transforming 1,000+ raw cutoff rows into plain-language verdict tiers to eliminate choice paralysis at scale.
Find My Best Fit College